
Economic taxonomy of vulnerabilities
AI-generated narration · 17 min
In cybersecurity, one of the most relevant questions and, at the same time, one of the hardest to answer precisely is: what is the financial cost of a vulnerability? Although there are several programs and practices focused on vulnerability management, the challenge of assigning a monetary value to each flaw, especially when it has not yet been exploited, remains underexplored from an objective and quantitative perspective.
As attacks become more sophisticated, regulatory demands increase, and contemporary digital ecosystems grow in complexity, understanding the real cost of a vulnerability becomes essential. This understanding allows strategic information security decisions to be grounded not only in risk perception, but also in tangible economic analysis.
Context and analytical data
Historically, decisions related to prioritization and investment in security have been based on qualitative assessments and risk models built from hypothetical scenarios. Although useful, these approaches do not always provide strong arguments to justify resource allocation when compared with areas such as finance, product, or executive leadership.
In this context, there is a need for analysis centered on the economic measurement of vulnerabilities, using real data. Based on a new data analysis, this study seeks to answer the following question more precisely:
What is the cost of a vulnerability, considering different severity levels and categories?
Answering this question provides important support for prioritization strategies, budget definition, and decision-making in information security.
Assumptions
To conduct the analysis in an objective, clear, and decision-relevant way, the following assumptions were established. They define the study scope and support the adopted methodological approach.
1. Vulnerabilities have measurable economic value: each vulnerability can be associated with a monetary value that reflects the effort required for its discovery and reporting, as well as the risks it represents. bug bounty programs are treated as a market reference for this measurement.
2. Vulnerability value increases with severity: it is assumed that vulnerability severity, determined by impact and likelihood of exploitation, is directly related to cost. Critical vulnerabilities tend to imply greater risks and, therefore, higher costs.
3. Bug bounty rewards are valid proxies for cost estimation: amounts paid in bug bounty programs are used as conservative estimates of vulnerability discovery cost. For greater rigor, the lowest value within each published reward range is always used.
4. The focus is exclusively on the discovery phase: the analysis does not include subsequent vulnerability lifecycle stages (such as remediation, revalidation, disclosure, or exploitation impact). It focuses only on the estimated cost of identification.
5. Security resources are limited and require strategic allocation: given that security budgets are finite, understanding per-vulnerability cost supports more effective decisions about effort and investment allocation.
Out of scope
Approach
Inspired by the information asymmetry theory presented in The Market for Lemons: Quality Uncertainty and the Market Mechanism [1], this study starts from the premise that markets can reveal prices even under uncertainty about the quality of traded goods, as long as minimally stable signaling mechanisms exist.
In information security, bug bounty programs function as these mechanisms by assigning differentiated monetary values to vulnerabilities according to perceived severity. Therefore, rewards are assumed to reflect, conservatively, a market value associated with vulnerability discovery and reporting, partially mitigating the asymmetry between those who identify vulnerabilities and those who bear their risk. Based on this premise, the methodology adopts a quantitative and comparative approach, using real bug bounty program data to estimate typical organizational payout levels across severity categories.
Although rewards do not represent the total cost resulting from the existence or exploitation of a vulnerability, they provide a standardized, empirically observable proxy for economic measurement. From an information asymmetry perspective, bug bounty programs operate as incentive markets in which price signals not only perceived vulnerability value, but also expected discovery effort. In this setting, independent researchers tend to invest rationally only when expected net payout exceeds marginal discovery, validation, and reporting costs, a necessary condition for profitability and operational continuity.
When offered amounts are perceived as insufficient relative to attack surface complexity or validation requirements, engagement and report volume tend to decline. Symmetrically, organizations dynamically adjust rewards as attraction or disincentive mechanisms, increasing payouts when qualified reports are scarce or reducing them when reported vulnerability volume exceeds triage and remediation capacity.
This cycle of entry, exit, and migration across programs works as a self-correcting mechanism. Therefore, while information asymmetry does not disappear entirely, it tends to remain residual and operationally acceptable, since persistent mismatches between required effort and payouts are quickly detected by researchers and repriced by the market.
Scope of the analysis
The analysis is restricted to the vulnerability discovery stage, that is, the effort required to identify and report a vulnerability with technical evidence. Remediation, revalidation, and disclosure phases are out of scope. Data is obtained exclusively from sources, prioritizing:
- Bug bounty platforms with open information;
- Rewards categorized by severity;
- Multiple geographies, for greater representativeness.
Rationale for the approach
By using market data (rewards effectively paid), this approach avoids the subjectivity typical of impact estimates and adopts a criterion recognized across sectors as a practical value reference. This method also enables future comparisons with other security investment models, such as penetration testing (pentests) or automated tools, providing a concrete basis to assess return on investment (ROI) and guide resource allocation.
Methodology
The methodology adopted in this study was designed to ensure transparency, reproducibility, and consistency in the analysis of data extracted from public bug bounty platforms. The main process steps are detailed below:
- Data collection is performed using custom scrapers developed to extract information from active programs that:
- Disclose financial values assigned to vulnerabilities;
- Clearly classify flaws by severity.
- Programs from companies of different sizes and sectors, with national and international coverage, are included to capture a representative market view.
- After collection, data is filtered using the following exclusion criteria:
- VDP (Vulnerability Disclosure Program) initiatives that do not offer financial rewards;
- Programs with inconsistent or incomplete severity or reward data;
- Generic rewards without severity linkage.
- Rewards are classified into the following categories, based on program-provided descriptions or, when unavailable, criteria compatible with the CVSS standard:
Informational
Low
Medium
High
Critical
- Value normalization, to avoid distortions in the results:
- For value ranges (e.g., $1,000 to $5,000), the minimum value in the range is used, adopting a conservative approach;
- All values are converted to U.S. dollars (USD), based on a reference exchange rate.
Analysis
A total of 808 bug bounty programs were analyzed, distributed across HackerOne, Bugcrowd, YesWeHack, Intigriti, BugHunt, and Bugpay. The sample includes active programs from organizations with different sizes, sectors, and geographic locations, providing a broad and representative view of the vulnerability reward market.
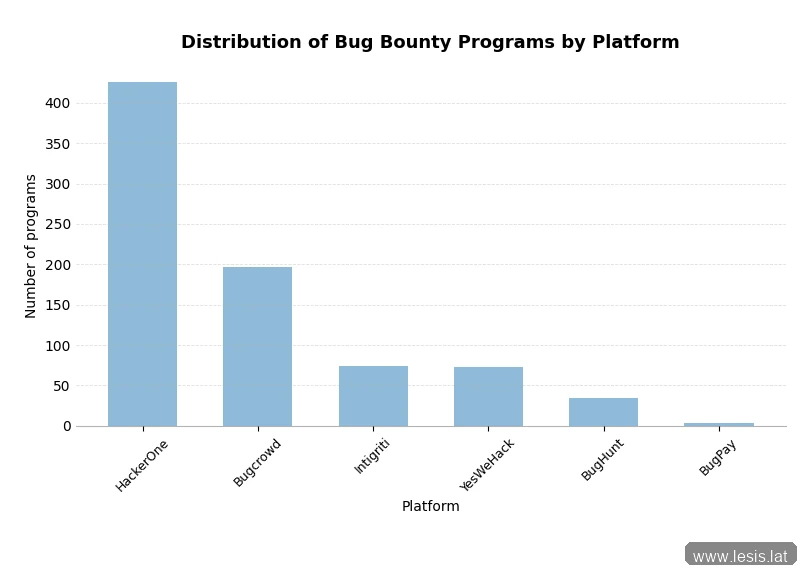
Figure 1: distribution of bug bounty programs by platform.
The data used in this analysis is available for reproduction and verification in the repository: https://huggingface.co/datasets/lesis-lat/bug-bounty-programs-rewards/viewer/default/train
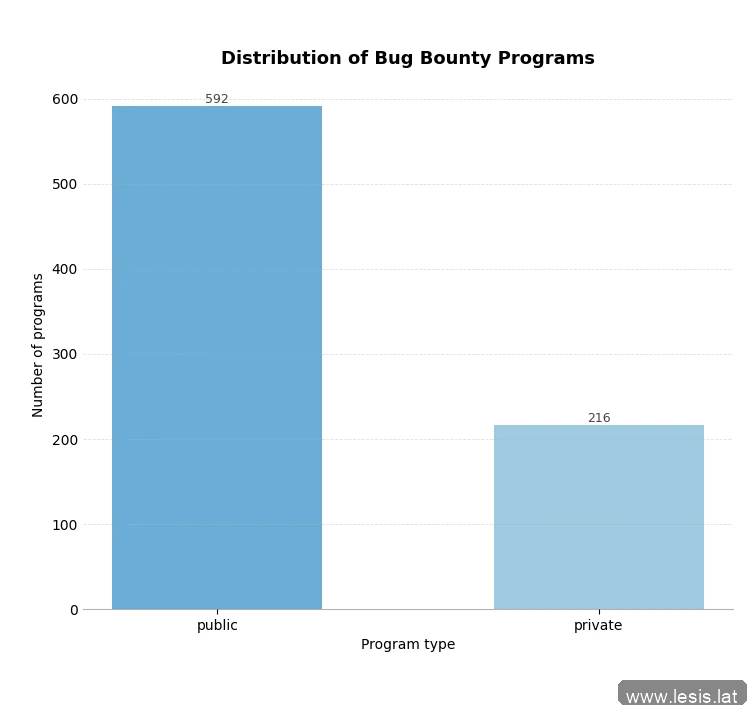
Figure 2: distribution of bug bounty programs by visibility type (public vs private).
The table below presents the minimum and maximum reward values observed in each severity category, highlighting the wide variation across programs and platforms. In particular, while low-severity vulnerabilities may have symbolic minimum rewards, upper ranges, especially for high and critical severities, reach significantly high values, reflecting different incentive strategies and risk perceptions.
| Low | Medium | High | Critical | |
|---|---|---|---|---|
| Minimum | $1.00 | $3.00 | $5.00 | $50.00 |
| Maximum | $2,000.00 | $47,175.93 | $58,969.91 | $100,000.00 |
Table 1: minimum and maximum bug bounty reward values by severity (USD).
These values define the full variation range in the observed data and serve as a basis for more robust statistical analyses.
Additionally, central tendency analysis reveals more stable pricing patterns by severity. The table below presents mean, median, and mode values, indicating that despite relevant outliers, reward concentration occurs around well-defined levels for each category.
| Severity | Mean | Median | Mode |
|---|---|---|---|
| Low | $154.75 | $100.00 | $100.00 |
| Medium | $563.93 | $350.00 | $500.00 |
| High | $1,825.83 | $1,000.00 | $1,000.00 |
| Critical | $4,601.35 | $3,000.00 | $3,000.00 |
Table 2: mean, median, and mode of rewards by severity (USD).
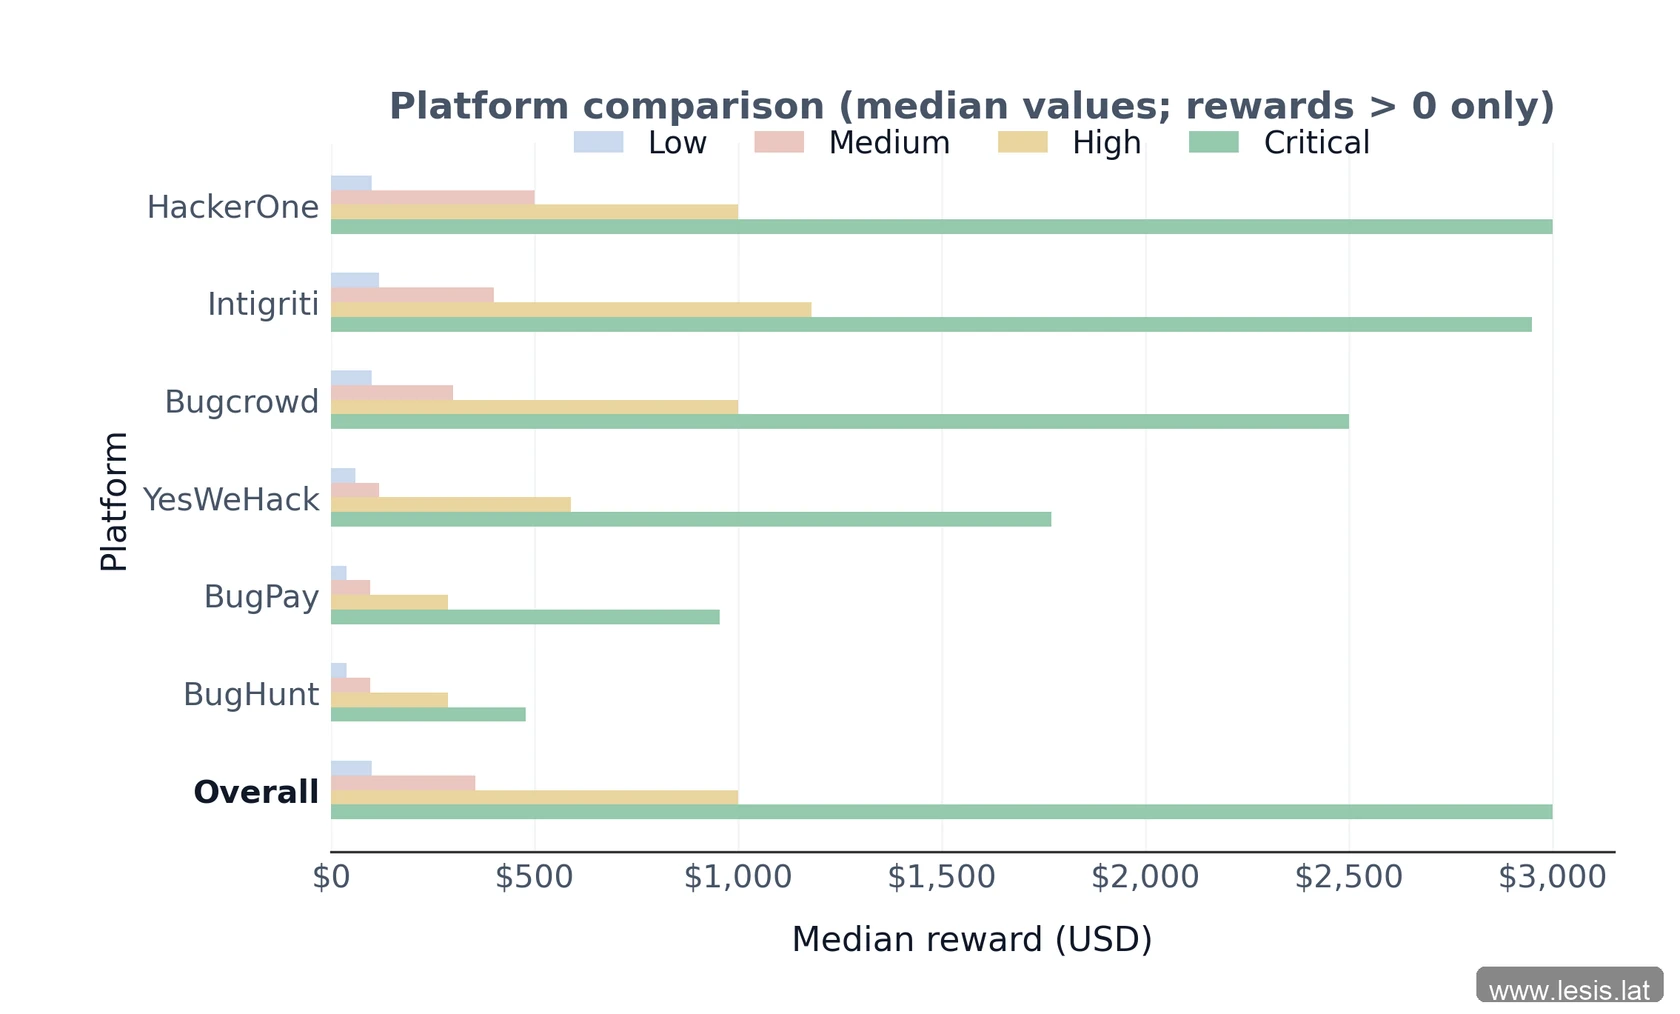
Figure 3: median reward comparison by platform and severity.
Comparing mean and median in light of skewness coefficients indicates that the arithmetic mean does not adequately represent typical vulnerability reward behavior. All severity categories show high positive asymmetry (skewness ranging approximately from 6.49 to 21.72), evidencing distributions strongly concentrated at lower values, with few exceptionally high payouts. Although skewness intensity varies across severities, especially in medium-severity vulnerabilities, this pattern explains the systematic divergence between mean and median and confirms mean sensitivity to extreme values, making robust measures more appropriate for data interpretation.
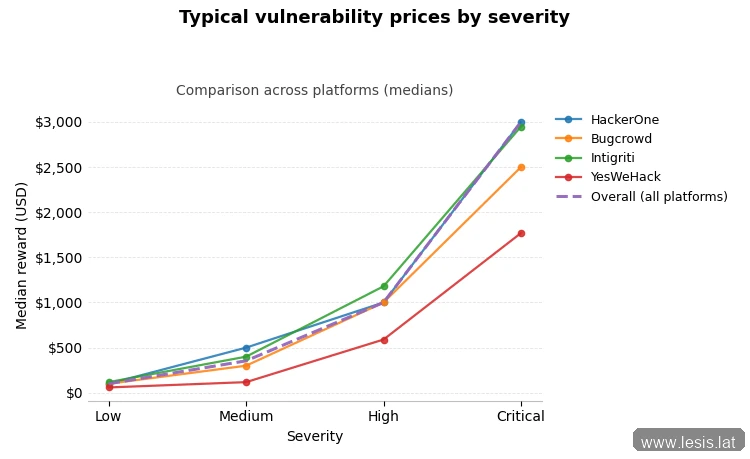
Figure 4: typical vulnerability prices by severity across platforms.
Reward value variability was assessed through the interquartile range (IQR), which captures dispersion in the central core of the distribution. A consistent increase in typical variability is observed as vulnerability severity rises. For low-severity vulnerabilities, IQR is approximately USD 141.03, indicating higher concentration of practiced values. This interval expands to USD 300.00 for medium severity, USD 1,410.30 for high severity, and USD 3,500.00 for critical vulnerabilities, showing a progressive widening of the range in which the most frequent rewards are concentrated. This behavior indicates that more severe vulnerabilities are associated not only with higher values, but also with greater economic uncertainty in pricing.
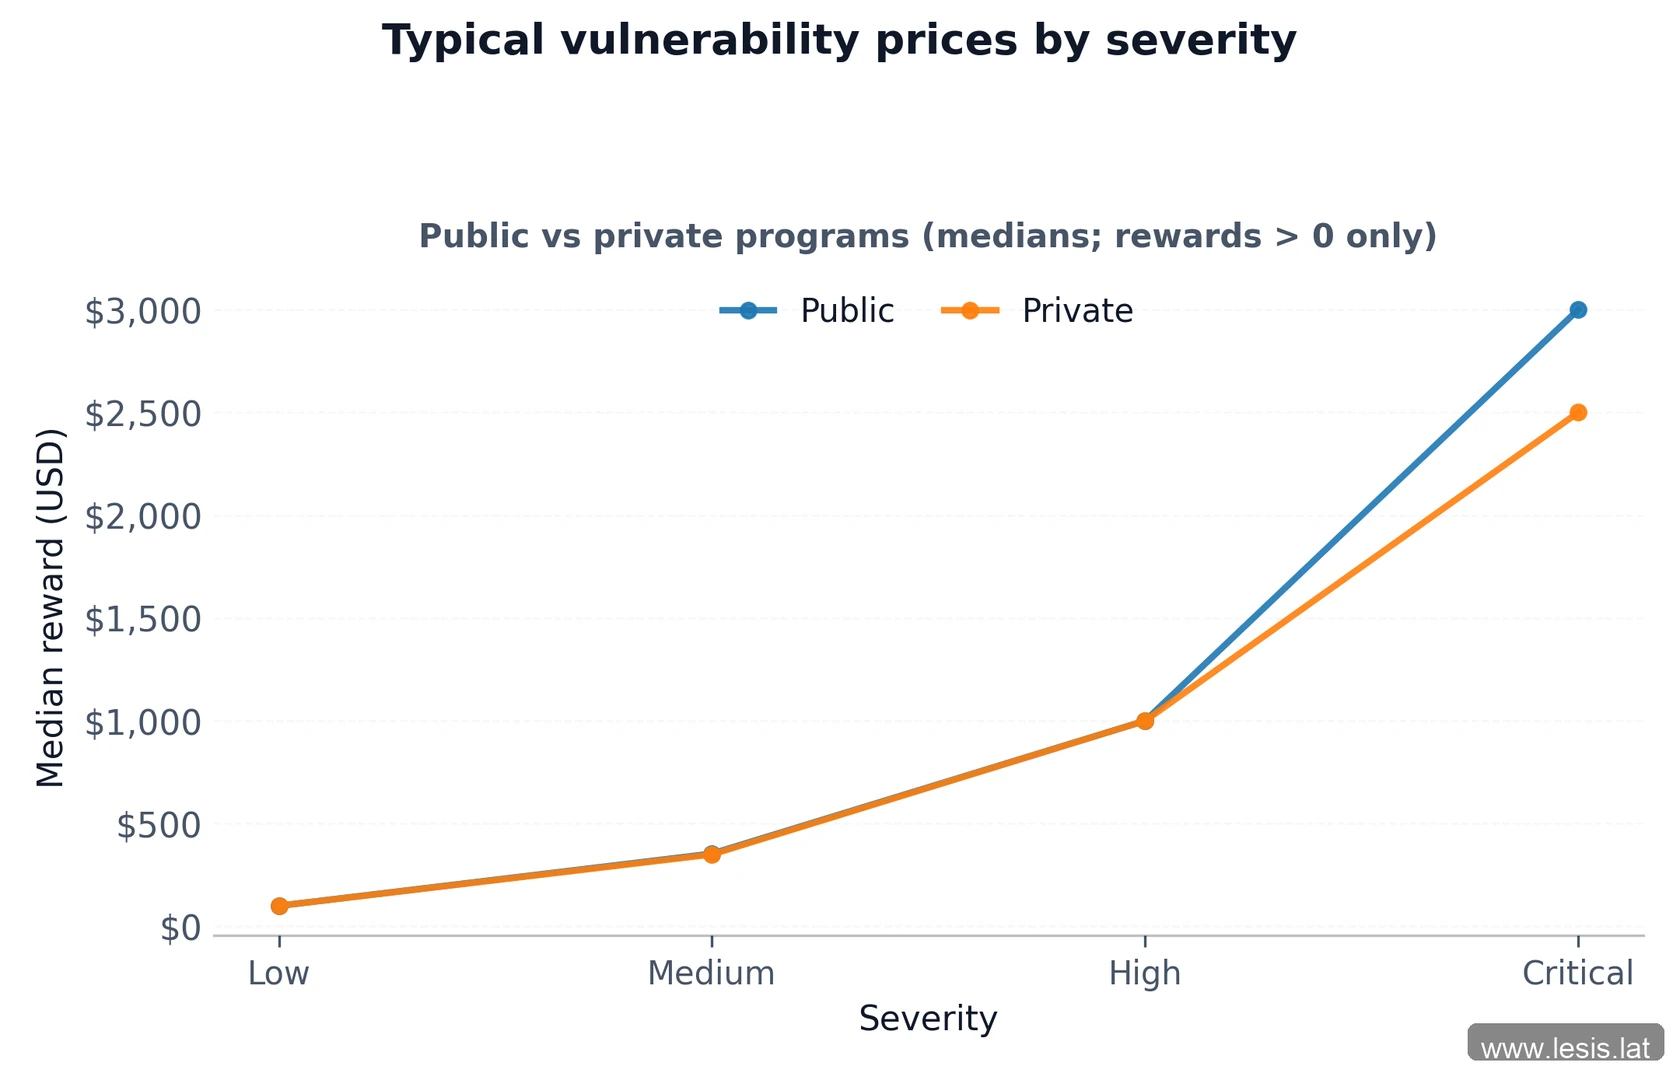
Figure 5: median rewards by severity for public vs private programs.
Taken together, the results show that while consistent severity-based pricing patterns exist, the bug bounty market presents high heterogeneity and recurring extreme values. Even so, central tendency and dispersion statistics support the conclusion that vulnerability discovery has an observable economic value differentiated by severity level.
Therefore, it is methodologically appropriate to state cost ranges by severity, provided these ranges are defined using robust measures such as median and interquartile range, and not interpreted as deterministic limits. Based on the analyzed data, low-severity vulnerability discovery has a typical cost concentrated between approximately USD 59 and USD 200, with a median of USD 100. For medium severity, the typical range lies between USD 200 and USD 500, with a median around USD 350. High-severity vulnerabilities show greater dispersion, with values concentrated between USD 590 and USD 2,000, and a median of USD 1,000, while critical vulnerabilities exhibit the highest cost ranges, approximately between USD 1,500 and USD 5,000, with a median of USD 3,000. These ranges reflect typical market behavior and highlight the progressive increase in economic uncertainty as vulnerability severity increases.
Conclusion
This study investigated the economics of vulnerability payouts using a quantitative approach based on real bug bounty program data. In this context, “cost” refers to the amount paid by organizations for accepted vulnerability reports, not the internal effort cost incurred by researchers to discover and report vulnerabilities. Starting from the premise that these programs operate as market mechanisms under information asymmetry, the analysis sought to objectively estimate how payout values vary by severity.
Results show that vulnerability discovery has an observable economic value that is systematically differentiated by severity. Statistical analyses revealed strongly skewed distributions across all categories, with recurring extreme values, making arithmetic mean inadequate as a standalone representative metric. In contrast, robust measures such as median and interquartile range proved more appropriate for capturing typical market behavior.
Based on these indicators, it was possible to estimate typical payout ranges associated with vulnerability discovery. Low-severity vulnerabilities show values concentrated between approximately USD 59 and USD 200, with a median of USD 100. For medium severity, the typical range lies between USD 200 and USD 500, with a median around USD 350. High-severity vulnerabilities concentrate between USD 590 and USD 2,000, with a median of USD 1,000, while critical vulnerabilities present the highest payout ranges, approximately between USD 1,500 and USD 5,000, with a median of USD 3,000. These ranges reflect typical market behavior and highlight the progressive increase in economic variability as severity rises.
From an economic perspective, these findings reinforce the interpretation of bug bounty programs as incentive markets in which rewards function as signals balancing supply of specialized researcher effort and organizational demand for flaw discovery. In this environment, researchers tend to allocate effort only when expected return exceeds marginal cost, supporting profitability and sustained operation. Information asymmetry, while still present, is disciplined by migration dynamics across programs and tends to remain at low, acceptable levels. Although such rewards do not represent the total cost associated with the existence or exploitation of a vulnerability, they provide a standardized empirical proxy for the organizational payout associated with vulnerability identification and reporting.
From a practical perspective, estimating Expected Vulnerability Discovery Cost (EVDC) by severity provides objective support for prioritization decisions, budget planning, and security investment assessment. By translating vulnerabilities into measurable economic ranges, the study helps reduce exclusive dependence on qualitative assessments and brings vulnerability management closer to an economic logic comparable to other technology and risk investments.
Finally, although limited to the discovery scope and bug bounty programs, this work establishes an empirical basis for future research exploring the relationship between discovery cost, remediation cost, and exploitation impact, as well as comparisons with other security investment models. In this sense, the analysis does not seek to provide deterministic values, but robust economic references for understanding and discussing vulnerability costs in contemporary digital environments.
References